Research has shown that graphic displays can communicate relationships among concepts more effectively than linear displays to some users. Graphic displays are logically equivalent to a tree structure, but usually do not have a notation. The decision to include a graphic display should take into account the domain and search habits of users. Graphic displays can be more effective in an interactive computer environment where terms are hyperlinked to the term details or a conventional flat format display.
There are many commercially available products that provide graphic displays of terms and term relationships. Some products are able to generate concept maps using the terms in a controlled vocabulary or even words in natural language using contextual and semantic information to determine the mapping. Concept maps that appear in conjunction with printed vocabularies are static. In an electronic system, a graphic display is generated in real time based on an underlying controlled vocabulary and/or a set of full text resources or other content objects.
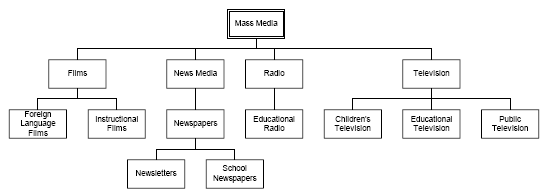
Example 160: Static concept map
NOTE: This graphic display was created with terms and hierarchies from the ERIC Thesaurus. Descending lines represent narrower terms.
Example 161: Concept map clusters generated in real-time
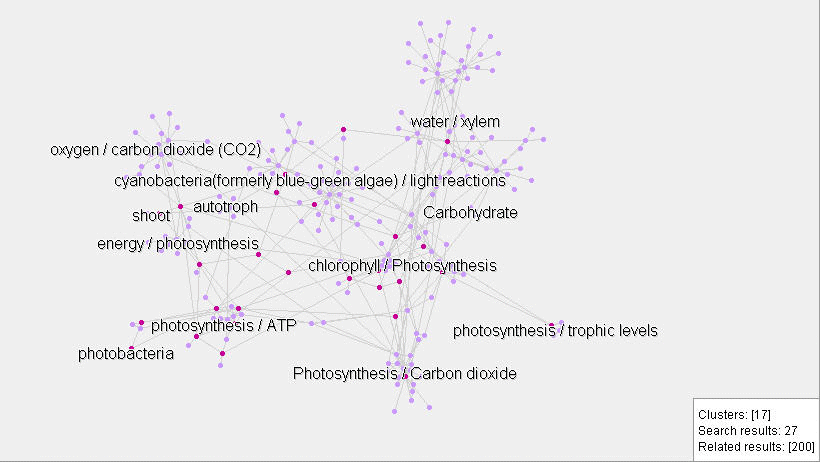
Source: Photosynthesis Research Map, xrefer
| Table of Contents |
| 1. Why Vocabulary Control | 2. Principles | 3. Structures | 4. Semantic Relationships |
| 5. Displays | 6. When to use | 7. Examples of use | 8. About Z39.19 |
©NISO, 2005 http://www.niso.org/
Source: Based on ANSI/NISO Z39.19-2005 ISBN: 1-880124-65-3
Guidelines for the Construction, Format, and Management of Monolingual Controlled Vocabularies